Practical Principles for analyzing data in R
Michael Kane
Assistant Professor of Biostatistics
Yale University
What do I mean by a "Practical Principle"?
A truth concerned with actually doing something that serves as a foundation for a behavior*.
Practical Principles for this talk
- Programming with Data
- Finding Structure in Data
- Computing with Data
- Productizing Data Analyses
Practical Principles For programming with Data
Part 1: Use R
IEEE Top Programming languages*

What about R works when computing with data?
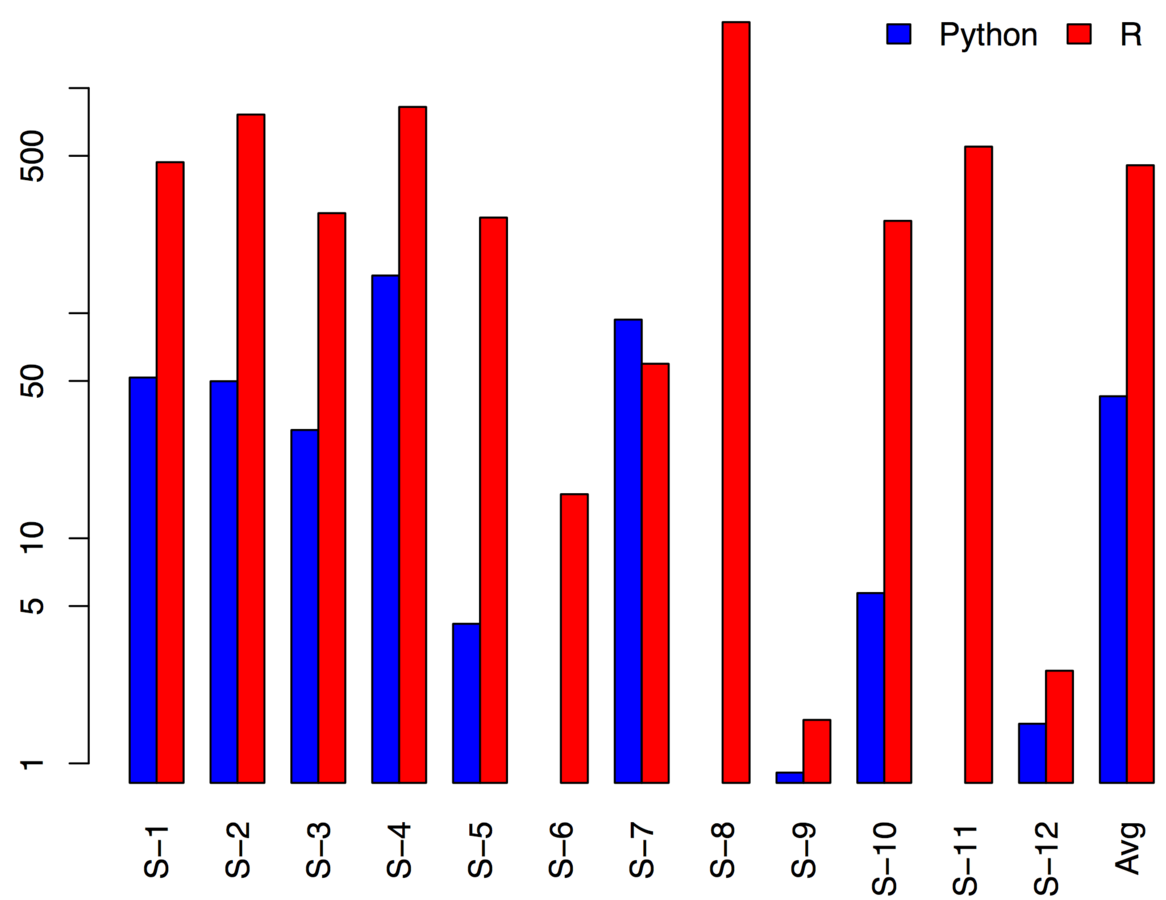
It's not the performance benchmarks
Jan vitek's python/R benchmarks
*Shamelessly taken from https://dl.dropboxusercontent.com/u/20315677/r-meetup-2016-slides.pdf

The Streetlight Effect*: a type of observational bias where people only look for whatever they are searching by looking where it is easiest.
* David H. Freedman (August 1, 2010). "The Streetlight Effect". Discover magazine.
R's syntax values development time over run time.
R makes it easy to create dialects. Some of them are even useful.
A dialect of a programming language or a data exchange language is a (relatively small) variation or extension of the language that does not change its intrinsic nature. - Wikipedia
Borrowing Pipes
create_summary(analyze(clean(load(file_name))))library(magrittr)
file_name %>% load %>% clean %>%
analyze %>% create_summaryPractical Principles For programming with Data
Part 1: Use R
Part 2: don't always use R
On a given day I'll program in
R, bash, sed, awk, c++, python, and julia
...but i'm often calling other languages from R
pirls = function(X, y, lambda, alpha=1, family=binomial, maxit=500,
                 tol=1e-8, beta=as(spMatrix(nrow=ncol(X), ncol=1), "dgCMatrix"),
                      beta_update=coordinate_descent) {
  converged = FALSE
  for(i in 1:maxit) {
    # Note that there aren't sparse family functions.
    eta      = as.vector(X %*% beta)
    g        = family()$linkinv(eta)
    gprime   = family()$mu.eta(eta)
    z        = eta + (y - g) / gprime
    W        = as.vector(gprime^2 / family()$variance(g))
    beta_old = beta
    beta = beta_update(X, W, z, lambda, alpha, beta, maxit)
    if(sqrt(as.vector(Matrix::crossprod(beta-beta_old))) < tol) {
      converged = TRUE
      break
    }
  }
  list(beta=beta, iterations=i, converged=converged)
}
template <typename ModelMatrixType, typename WeightMatrixType,
          typename RealVectorType, typename BetaMatrixType,
          typename UIntVectorType>
BetaMatrixType coordinate_descent(const ModelMatrixType &X,
  const WeightMatrixType &W, const RealVectorType &z, const double &lambda,
  const double &alpha, BetaMatrixType beta,
  const UIntVectorType &active_cols, unsigned int maxit)
{
  double thresh = accu(W) * lambda * alpha;
  double quad_loss = quadratic_loss(X, W, z, lambda, alpha, beta);
  double quad_loss_old;
  BetaMatrixType beta_old(beta);
  for (unsigned int i=0; i < maxit; ++i) {
    beta_old = beta;
    beta = arma::sp_mat(beta_old.n_rows, beta_old.n_cols);
    quad_loss_old = quad_loss;
    for (auto it=active_cols.begin(); it != active_cols.end(); ++it)
      beta(*it, 0) = update_coordinate(*it, X, W, z, lambda, alpha,
                                       beta_old, thresh);
    quad_loss = quadratic_loss(X, W, z, lambda, alpha, beta);
    if (quad_loss >= quad_loss_old) {
      beta = beta_old;
      break;
    }
  }
  return beta;
}
In practice: Rcpp
mycd = function(X, W, z, lambda, alpha, beta, active_cols, maxit = 1000L) {
  W = as(diag(length(W)), "dgCMatrix")
  beta = as(beta, "dgCMatrix")
  z = matrix(z, nrow=length(z))
  c_coordinate_descent(X, W, z, lambda, alpha, beta,
                       as.integer(0:(ncol(X)-1)), maxit)
}

fit = pirls(x, y, lambda=lambda, family=gaussian, beta_update=mycd)
observations
C++ is hard to program in
R makes it easy for me to
- Build a reference implementation
- Profile my code
- Call C++
Use R for algorithm development, optimization, building, testing, and benchmarking.
Practical Principles For Analyzing Data with R
Part 1: Exploration is critical
"The greatest value of a picture is when it forces us to notice what we never expected to see." --John Tukey

Practical Principles For Analyzing Data with R
Part 1: Exploration is critical
Part 2: Think carefully about what you want to solve before thinking about the analysis
An example in neruo-psychology
The Consortium for Neuropsychiatric Phenomics (CNP) study includes imaging of a large group of healthy individuals from the community (138 subjects), as well as samples of individuals diagnosed with schizoprenia (58), bipolar disorder (49), and ADHD (45).
The participants, ages 21-50, were recruited by community advertisements from the Los Angeles area and completed extensive neuropsychogical testing, in addition to fMRI scanning. (From OpenFMRI)
Experiment
In the Balloon Analogue Risk Task (BART) a participant is presented with a balloon and offered the chance to earn money by pumping the balloon up by clicking a button. Each click causes the balloon to incrementally inflate and money to be added to a counter up until some threshold, at which point the balloon is over inflated and explodes. Thus, each pump confers greater risk, but also greater potential reward. If the participant chooses to cash-out prior to the balloon exploding then they collect the money earned for that trail, but if balloon explodes earnings for that trial are lost. Participants are not informed about the balloons breakpoints. (From Impulsivity)
We want to see if we can diagnose from BART Telemetry
onset,duration,reaction_time,trial_number,trial_type,button_pressed,action,explode_trial,trial_value,trial_cumulative_value,payoff_level,onset_noTriggerAdjust,pid
2.03216603999999,1.20839207400013,1.20839207400013,1,BALOON,5,ACCEPT,1,5,5,5,0.0321660399999928,sub-10159
5.87107120700011,0.625477546000184,0.625477546000184,1,BALOON,5,ACCEPT,1,5,10,5,3.87107120700011,sub-10159
8.76679230200034,0.561760724999658,0.561760724999658,1,BALOON,5,ACCEPT,1,5,15,5,6.76679230200034,sub-10159
11.1826955680003,0,0,1,BALOON,NA,EXPLODE,1,0,15,5,9.18269556800033,sub-10159
14.9222235540001,0.470330939000178,0.470330939000178,2,BALOON,5,ACCEPT,0,5,5,5,12.9222235540001,sub-10159
Different number of samples per patient
- We want to see if we can diagnose a subject
- Different number of samples per subject
- Not clear how to normalize patients
- Not clear which features we should extract
Practical Principles For Analyzing Data with R
Part 1: Exploration is critical
Part 2: Think carefully about what you want to solve before thinking about the analysis
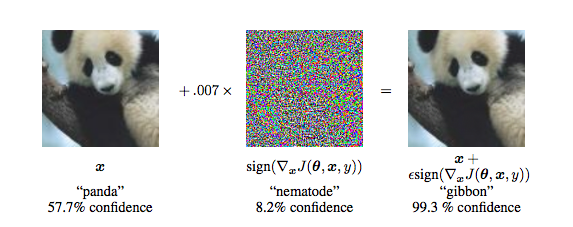
Part 3: The less you understand an analysis the less you should trust it
Breaking convnets on imagenet
Figure from Explaining and Harnessing Adversarial Examples by Goodfellow et al.

Practical Principles For Computing with Data in R
Part 1: compute cycles are cheaper than brain cycles

Practical Principles For Computing with Data in R
Part 1: compute cycles are cheaper than brain cycles
Part 2: horizontal scalability beats vertical when compute is a commodity
library(foreach)
library(iterators)
library(doMC)
registerDoMC(cores = 1024)

ans = foreach(it=make_data_gen()) %dopar% {
  process_data(it)
}
Practical Principles For productizing analyses in R
Part 1: Exploration is not analysis
Exploration is where you...
Analysis is where you...
- Develop intuition
- Find surprises in data
- Formalize a hypothesis
- Fit and evaluate a model
- (Fail to) Reject a hypothesis
- Provide a product
Practical Principles For productizing analyses in R
Part 1: Exploration is not analysis
Part 2: an Analysis may make a good web application
An example in Targeted Cancer Therapy
There is no panacea
Data understanding before models
Principles before procedures
Problem-solving skills before technology
Caterpillar Talk
By Michael Kane
Caterpillar Talk
- 2,158


