Graphical Model Approaches to Integrating Cell Tower and Spatial Data
Michael Kane
Owais Gilani
What is this talk about?
-
There should be a "science of human mobility."
-
Graphs are the right objects for capturing mobility at the population scale.
-
Graphs based on mobility data "make sense" in a spatial sense.
-
An application in pollution exposure
-
Other applications (if there is time).
Human Mobility
The aggregate spatial movements of people at the population level in order to:
-
understand the effect of environment condition on health (Eg. pollution exposure)
-
determine the extent to which events like natural disasters affect community health (Eg. hurricanes)
-
understand how diseases will spread in the general population
We measure mobility with cellphones
Call Detail Records (CDR) - produced by a telephone contains various attributes call, texts, and data transfer including time, duration, completion status, source and destination number, and location
Advanced Wireless Service (AWS) - produced by towers and contains tower id, anonymized device id, time, duration
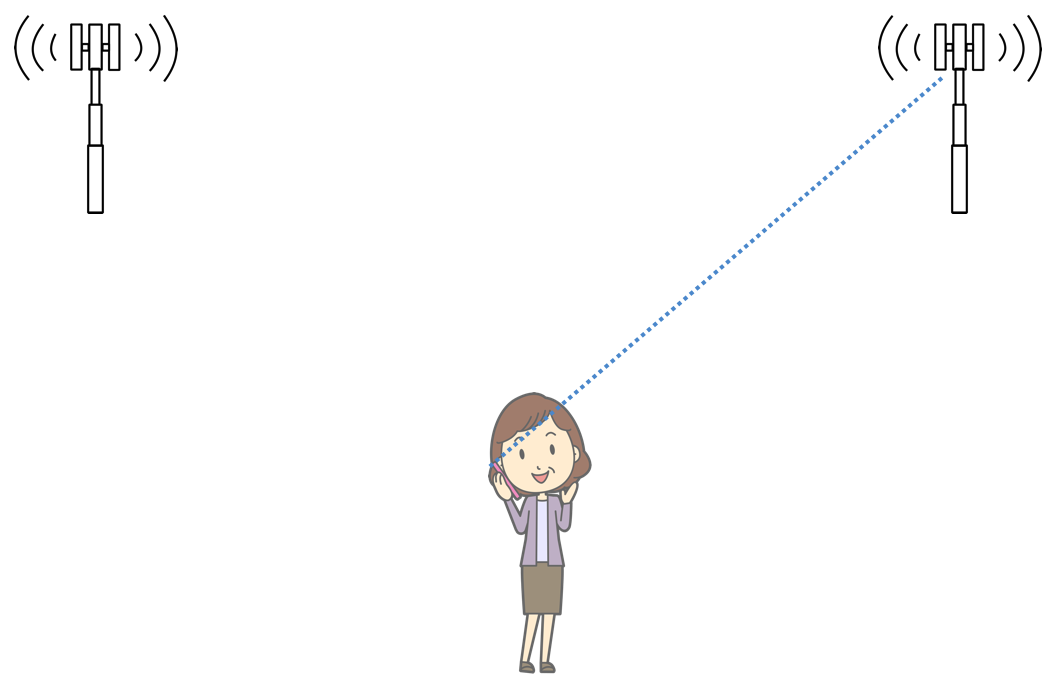
Cell Towers and Your Phone
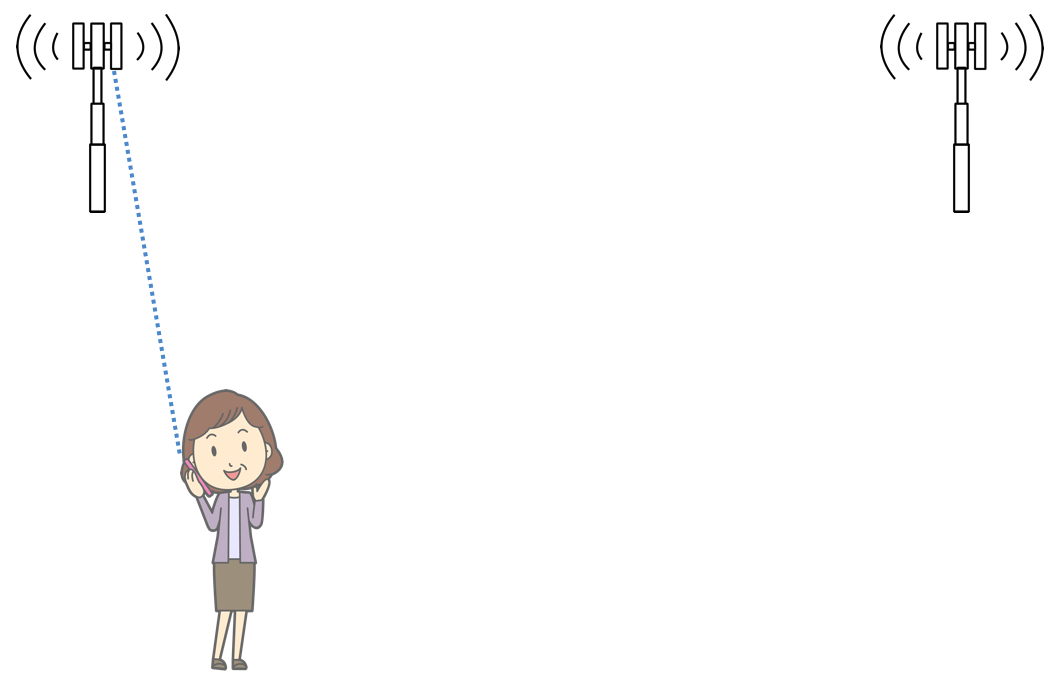
Cell Towers and Your Phone
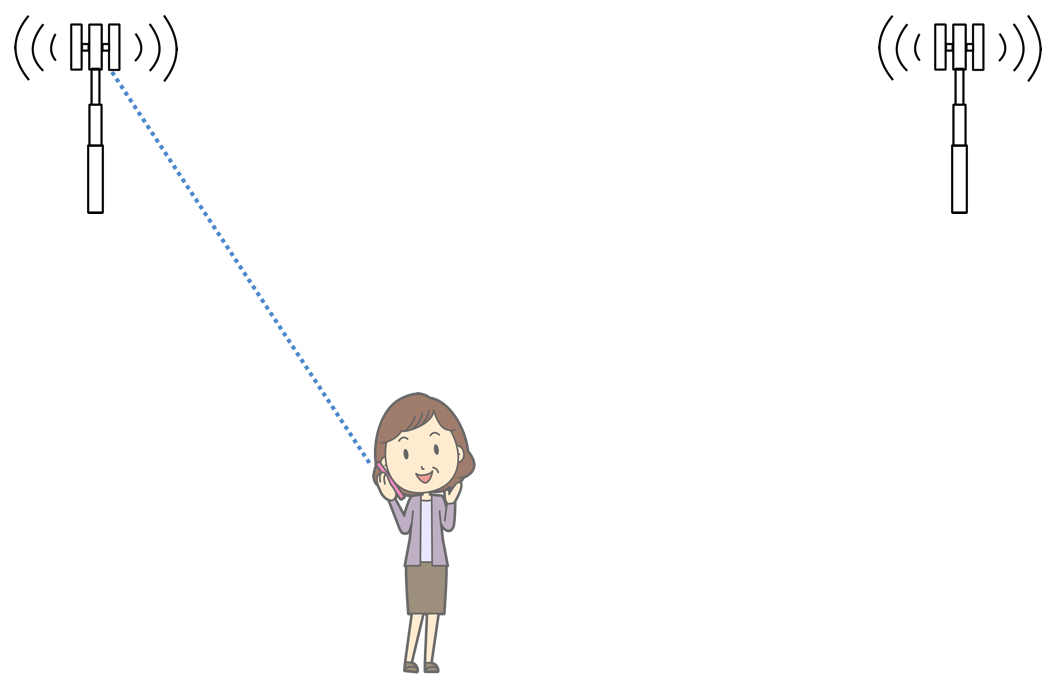
Cell Towers and Your Phone
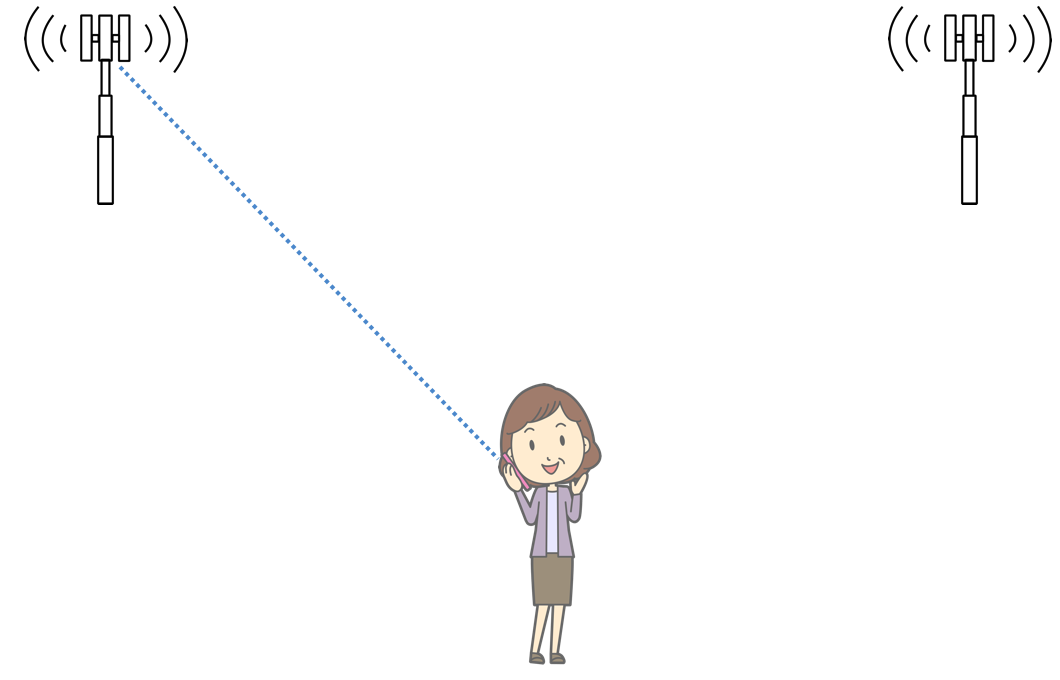
Cell Towers and Your Phone
AWS Advantages
Most complete
-
passive collection
-
avoids bias of CDR's
Location anonymization is inherent to the collection process
Provides a natural binning
How many towers are there?
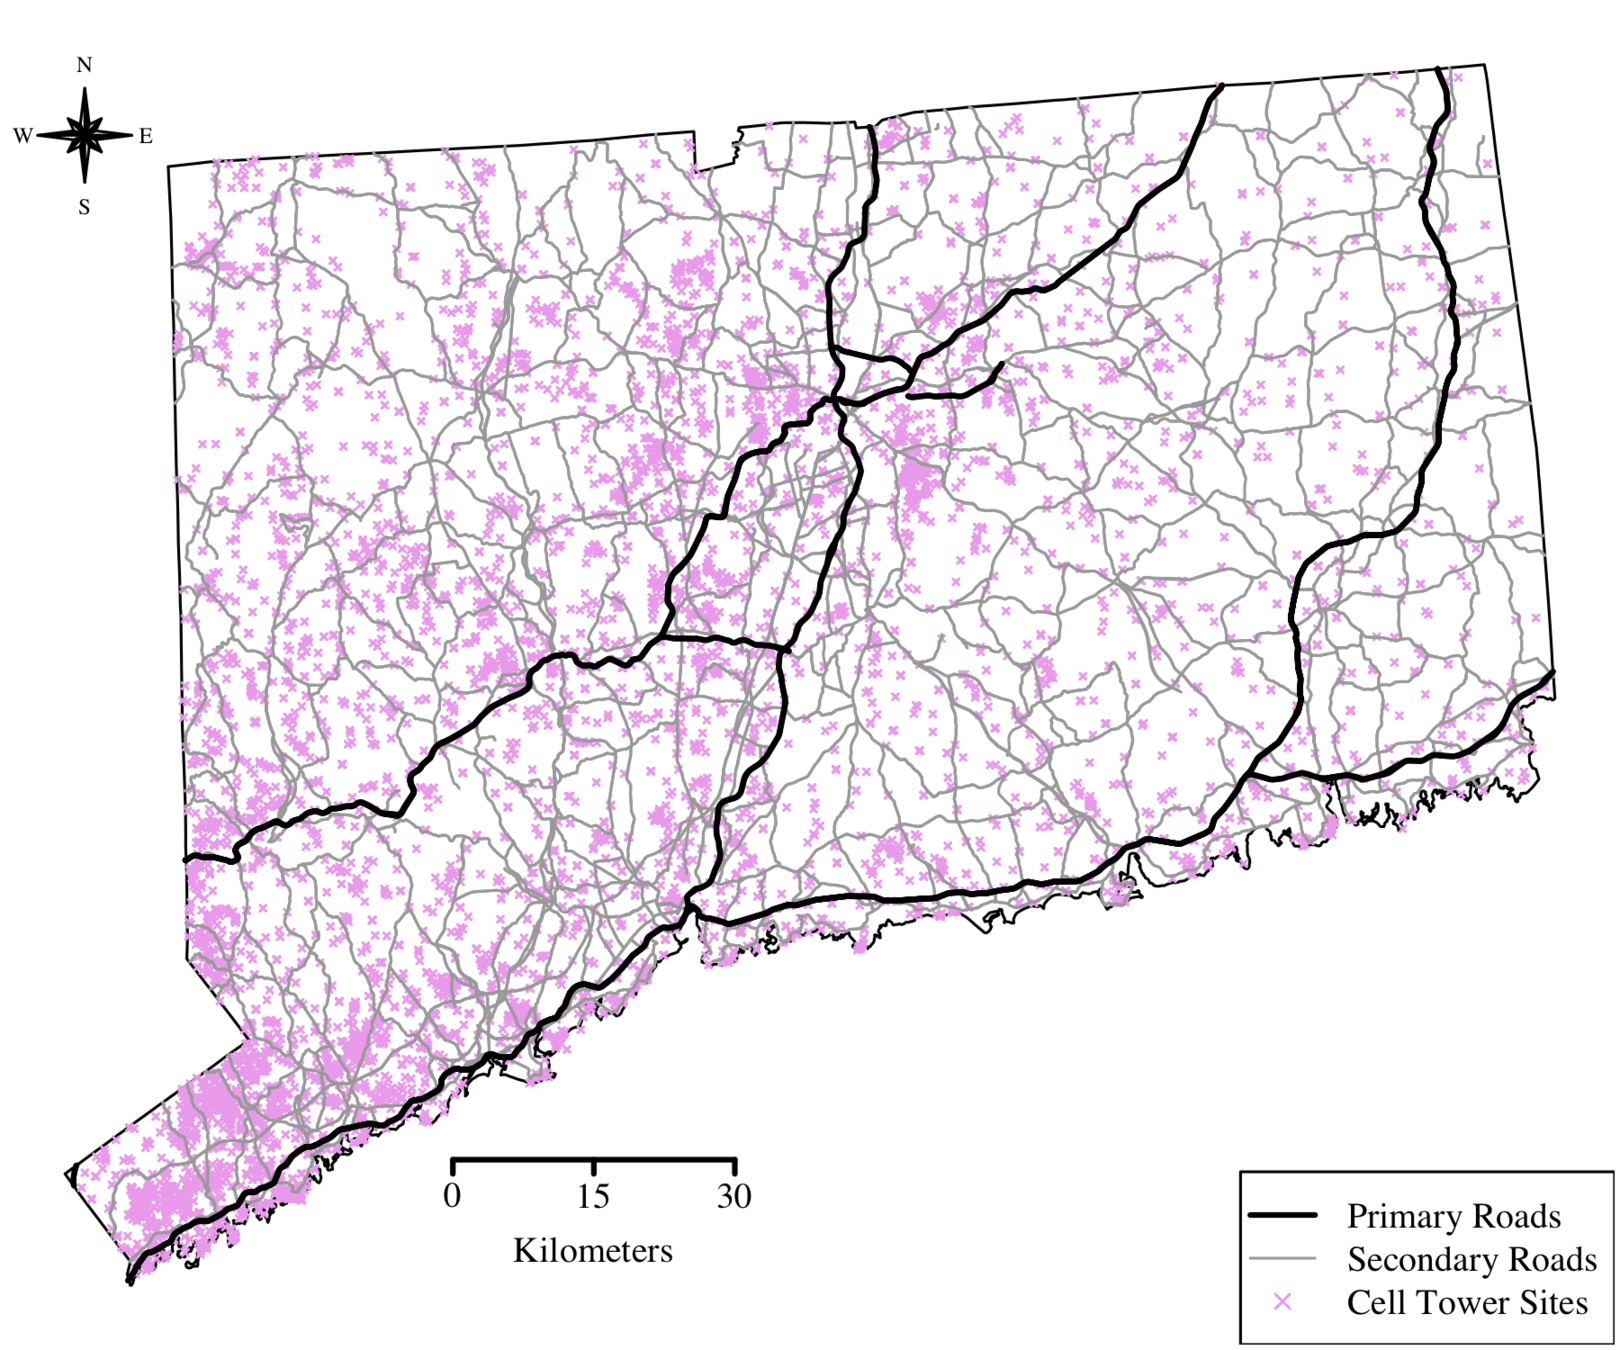
Mobility Graphs
Each tower is a vertex
Edges encode movement between tower locations
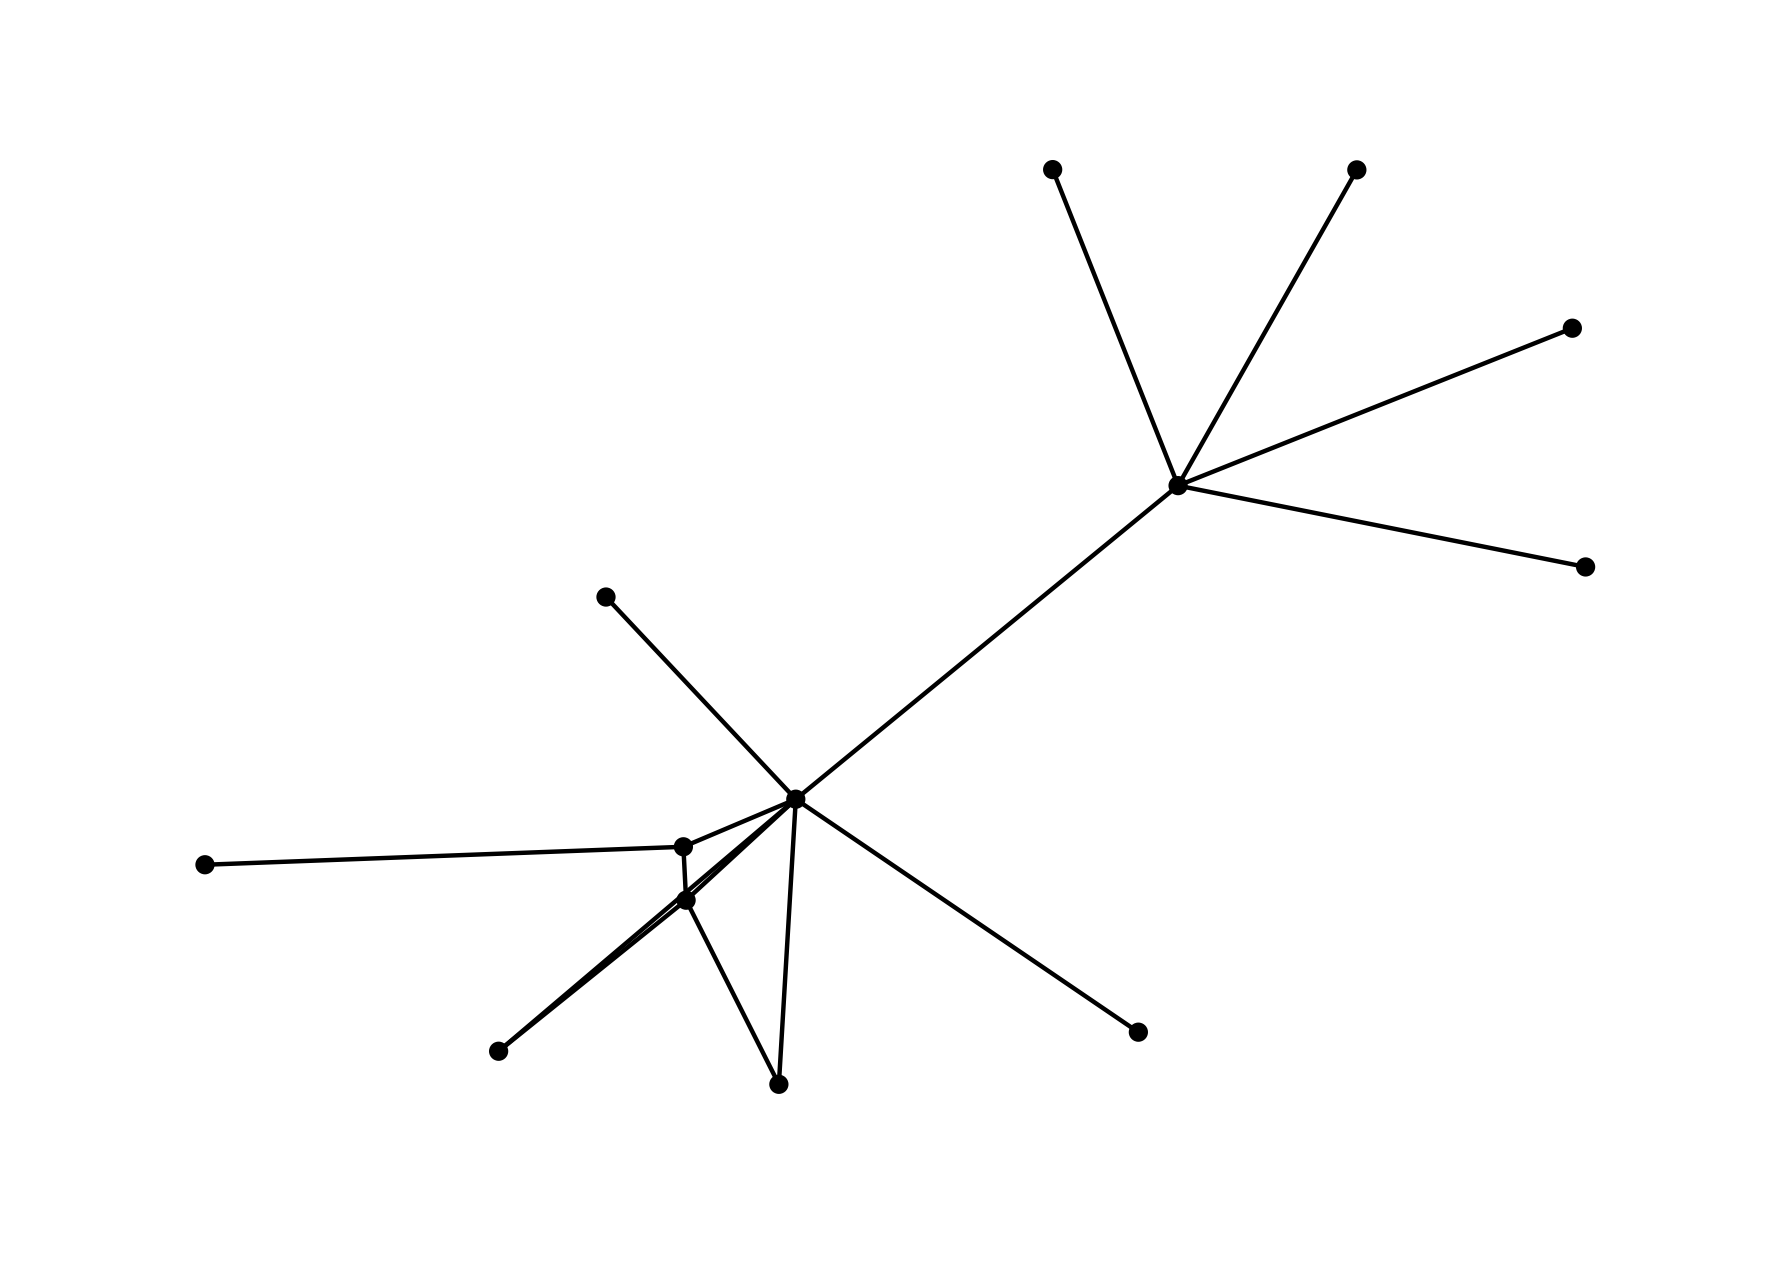
Graphs as High-Dim. Objects
A mobility graph with \(n\) nodes can be represented as \(n \times n\) adjacency matrix \(M\) and has rank \(\leq n\).
Undirected: Focus on connectivity and is more appropriate for time-intervals at the period of cyclic activity.
Directed: Focus on migration and tells us about the transitions of group rather.
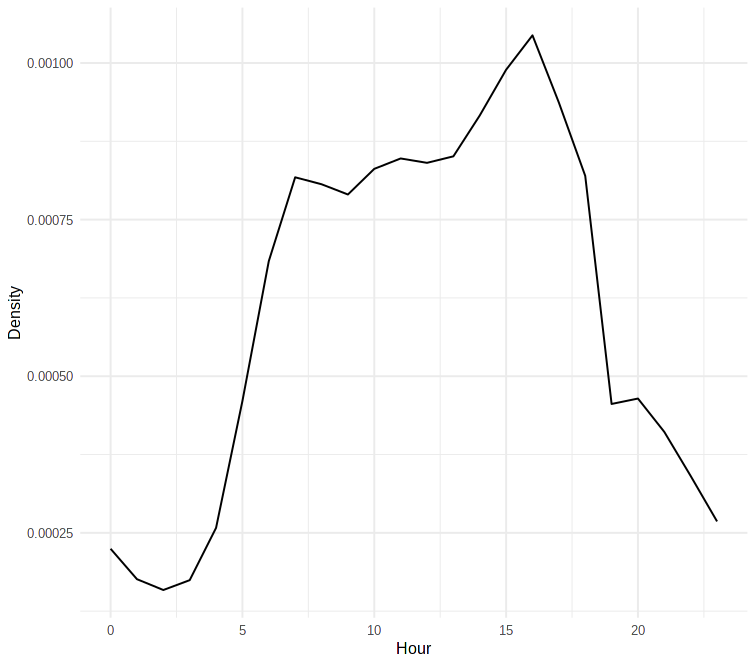
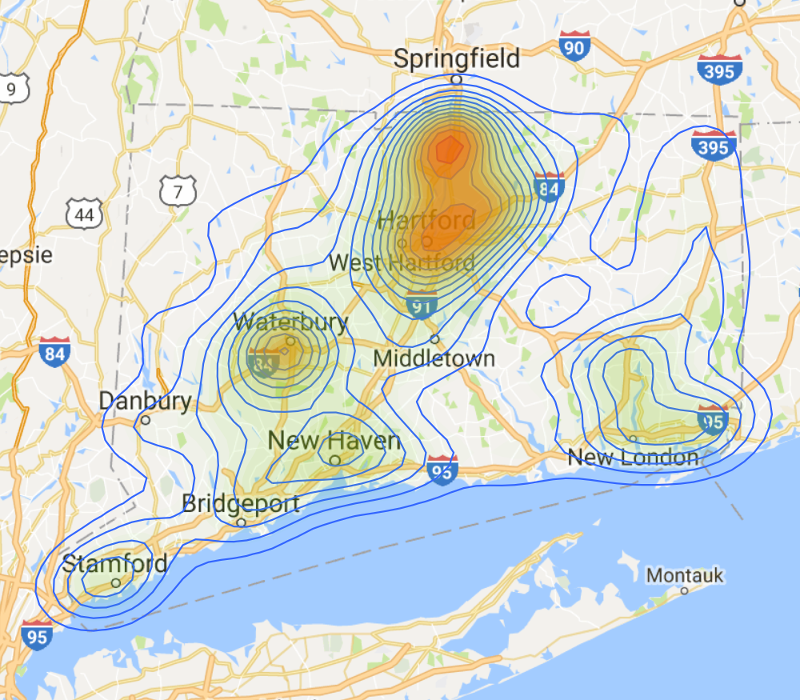
CT Connectivity Density
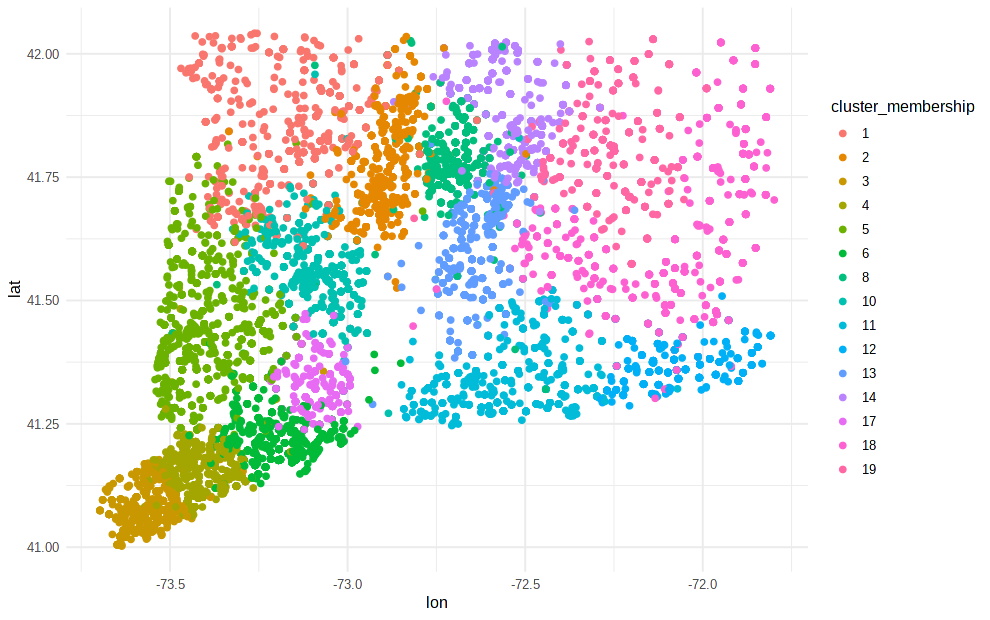
CT Connectivity Communities
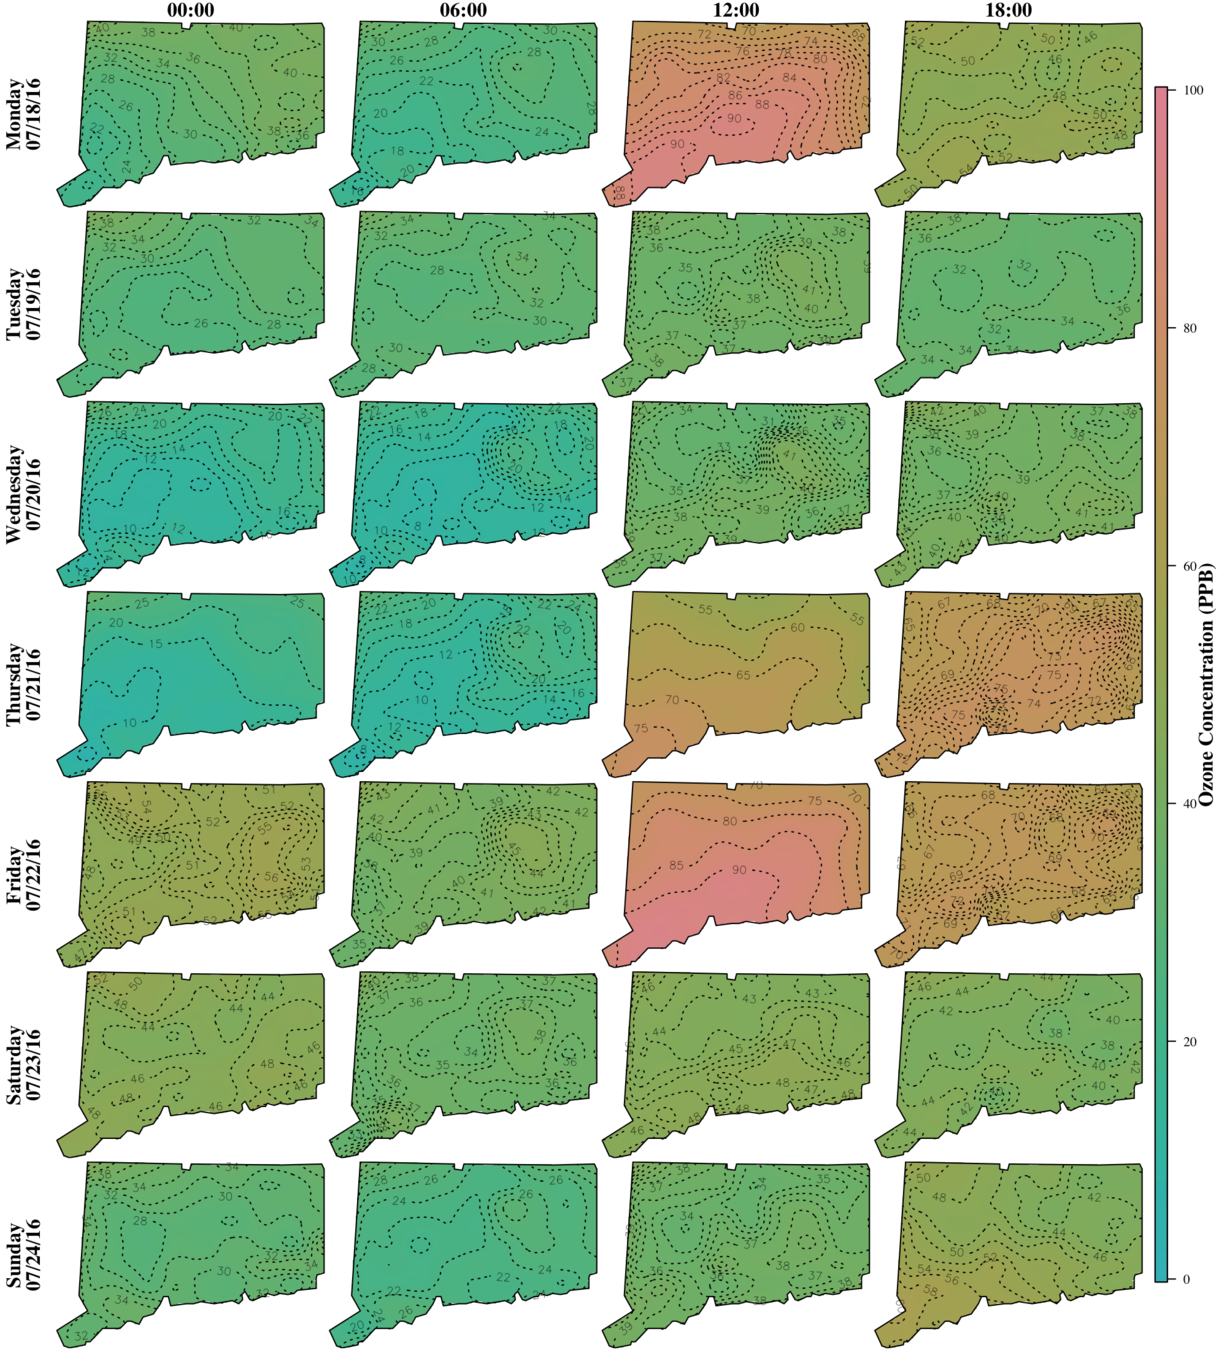
Mobility Network Application: Environmental Ozone Exposure
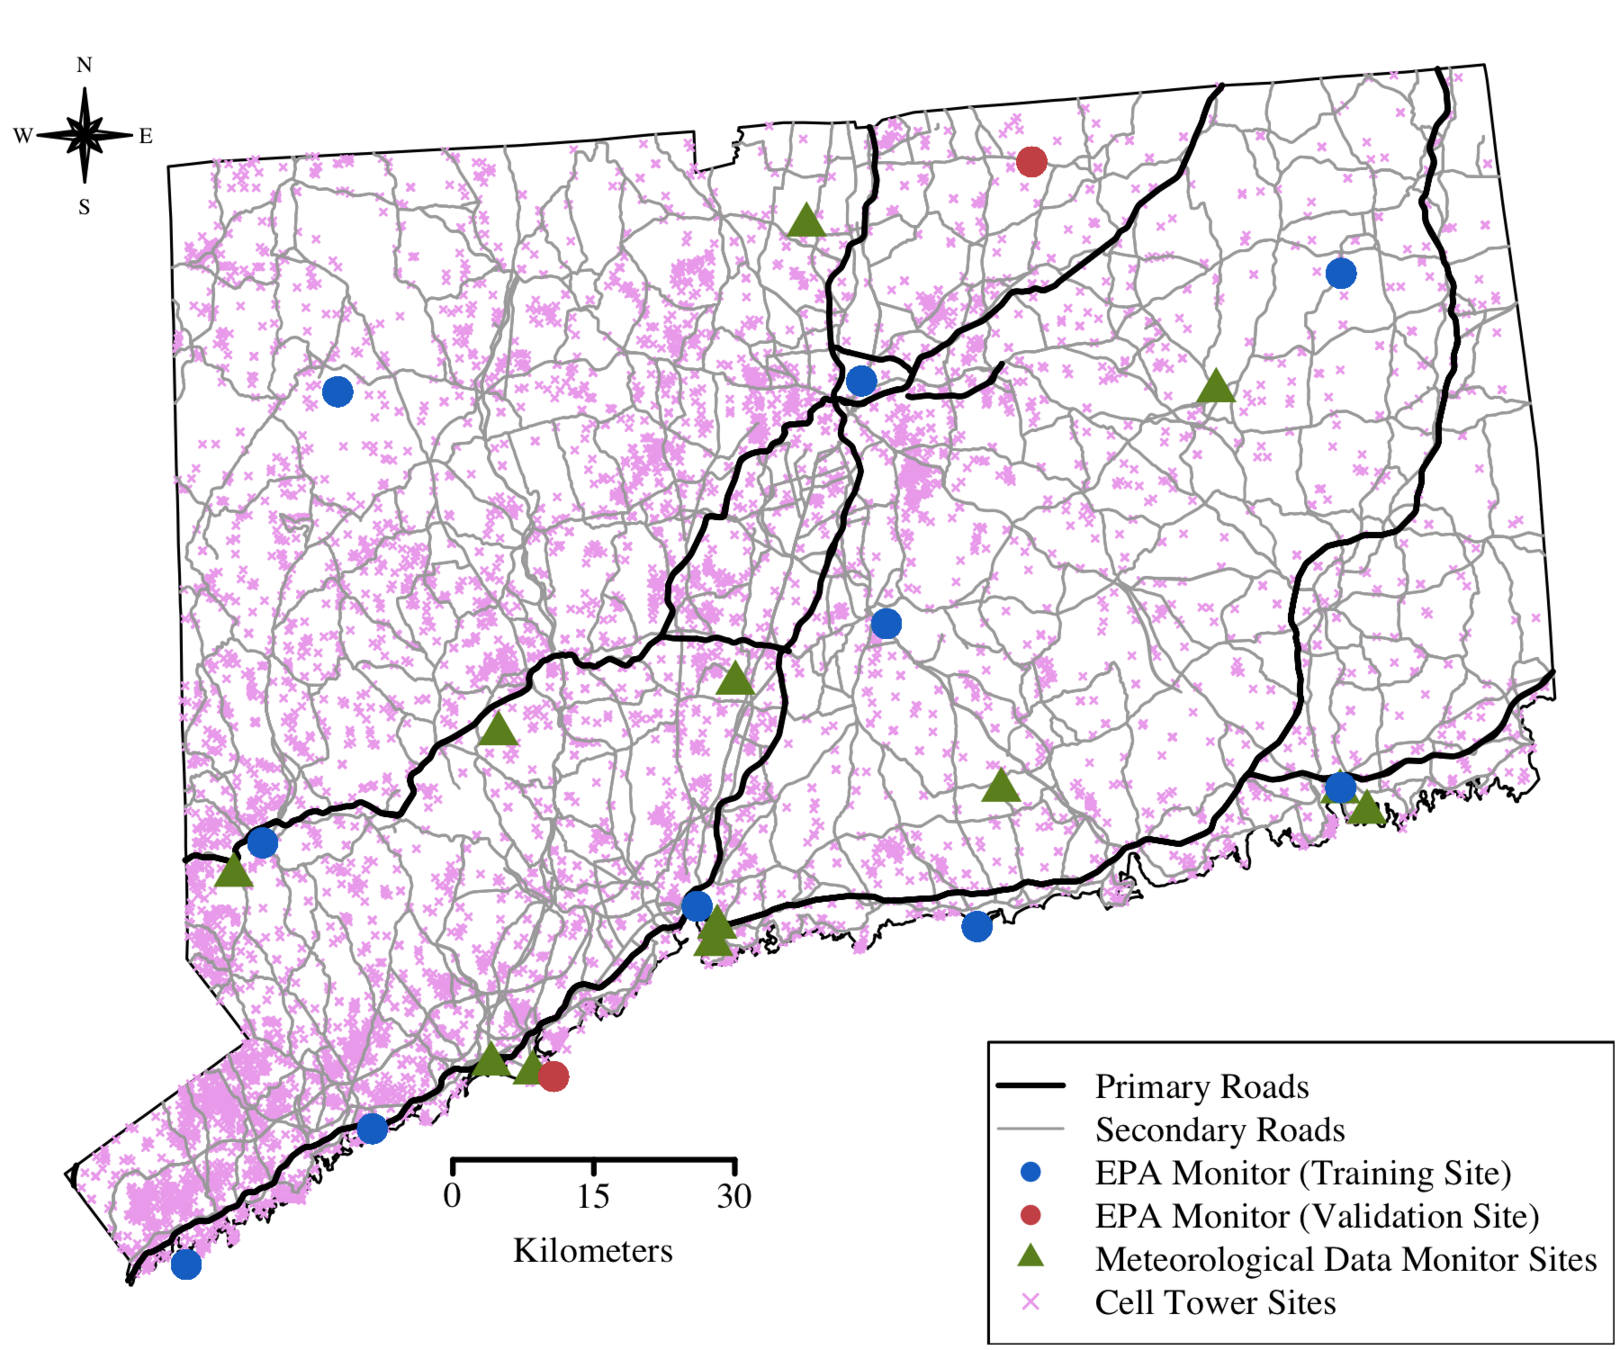
- Hourly ozone concentration (ppb)
- July 6 - August 5 2016
- 10 sites for model fit and 2 for validation
- 744 obs at each site
- About 10,000 towers
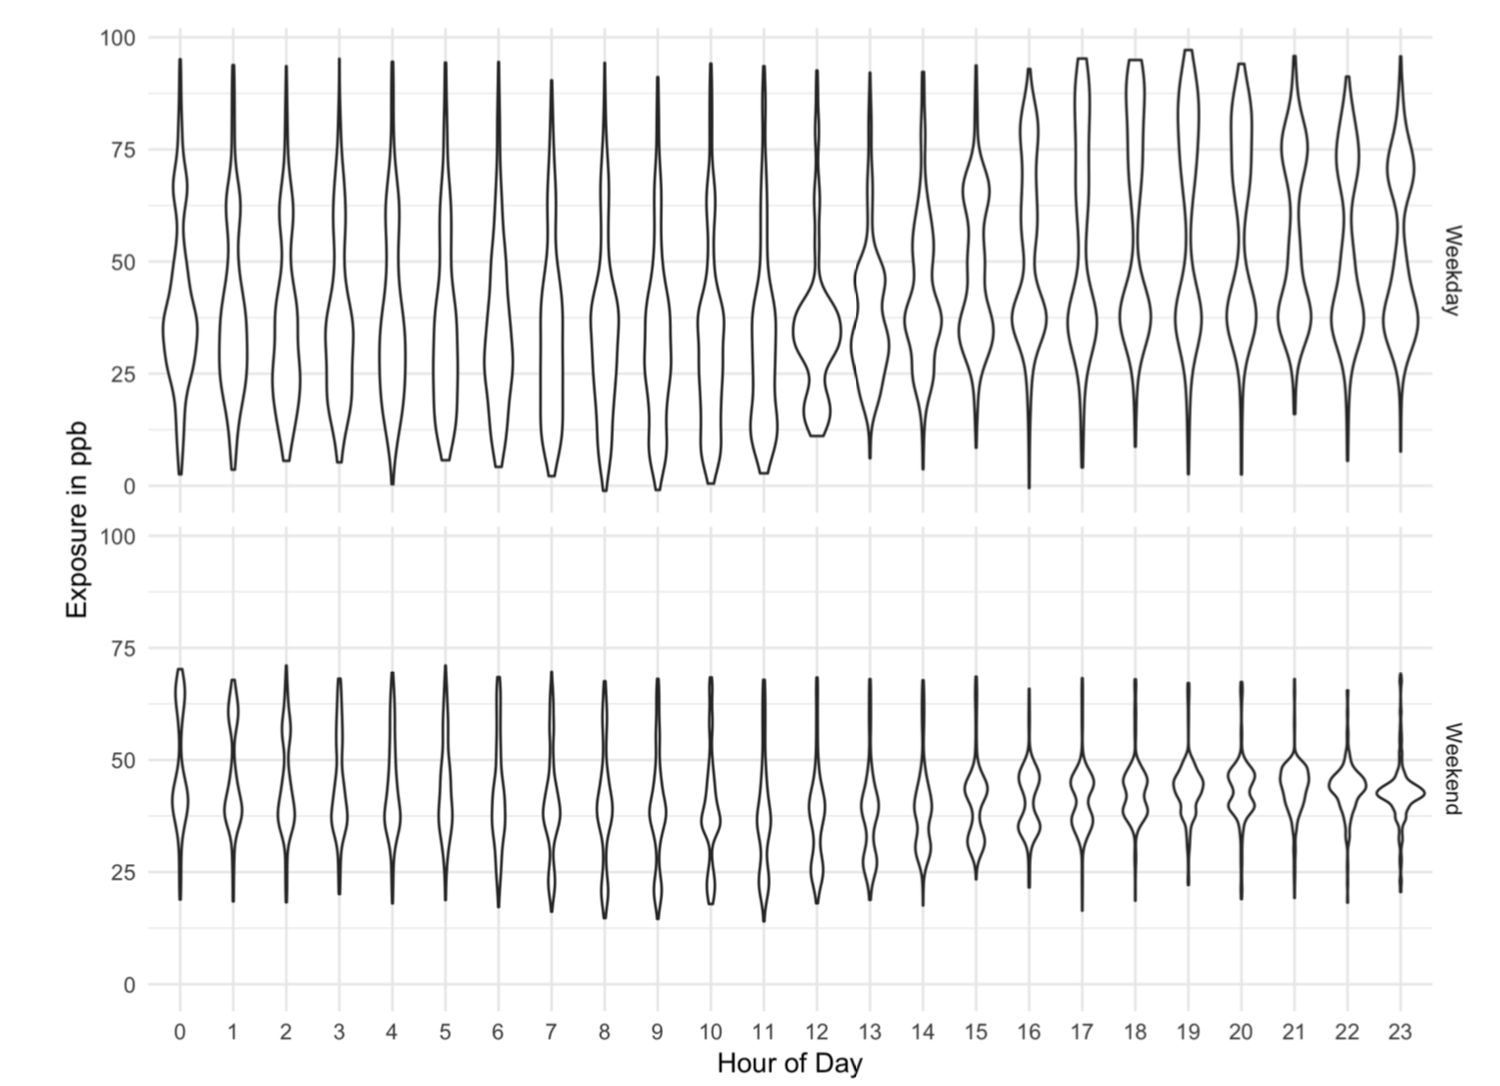
Exposure Distribution
Difference Mobility vs. Static 8-hour Max Exposure Difference

Less Exposure than Expected
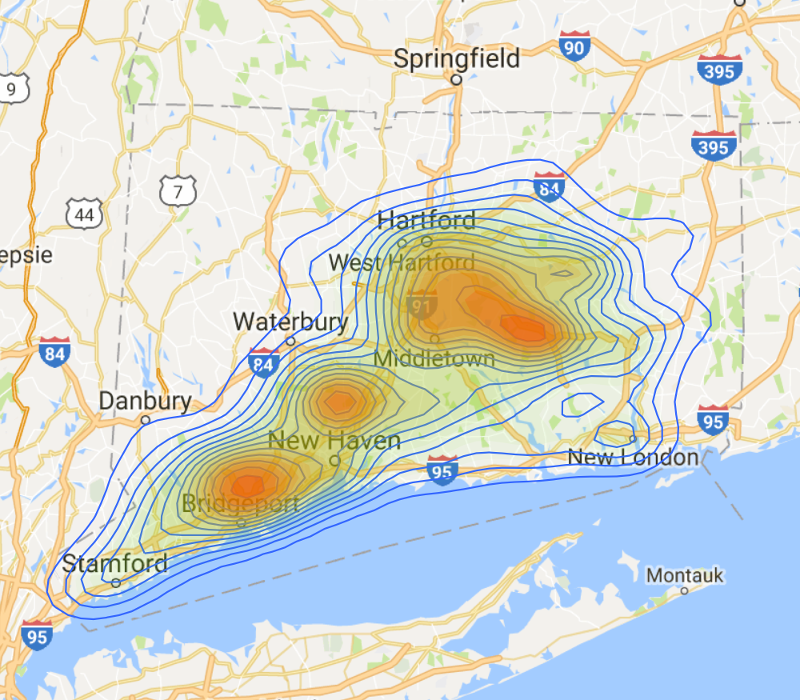
More Exposure than Expected
Current Work
Taxonomy of types of mobility graph that can be constructed and application domains.
Disease models taking into account mobility:
-
Yearly outbreaks - influenza
-
Herd immunity - Measles
Time-series representations of mobility networks.
Thanks
NESS 2019
By Michael Kane


